Decentraland Analytics
Since its birth in 2015, Decentraland has been one of the most popular virtual reality (VR) platforms paired with NFTs. Within the platform, users can create, experience, and monetize their VR content and applications. Specifically, the finite, traversable, 3D virtual space is called LAND, an NFT asset maintained on the Ethereum blockchain, transactions of which remain traceable and immutable.
The 16m x 16m smallest unit of LAND is named a parcel, identified by cartesian coordinates (x,y). On each parcel, an owner can build a scene by using design tools like the Builder or the Decentraland SDK, creating and offering a parcel-specific virtual experience to other users. Initially, the values of both x and y spanned from -150 to 0 to 150, constituting 90,601 (i.e., 301x301) different parcels. Then the upper-right corner of LAND has been expanded by the AETHERIAN project, and, at the time of writing, there exist 92,598 parcels in total.
Using the OpenSea API, all the historical events (e.g., auctions, sales, transfers) of 92,598 parcels are retrieved. Between 2018 and 2020, there were 244,695 transactions, 6,107 transactions (i.e., 6.6%) of which were the actual sales. Let’s first focus on those sales to study the determinants of virtual real estate prices.
The focal dependent variable is the log of selling prices in USD (i.e., $\log{(Selling \text{ } price)}$). The figure below presents the trend of the monthly average of $\log{(Selling \text{ } price)}$.
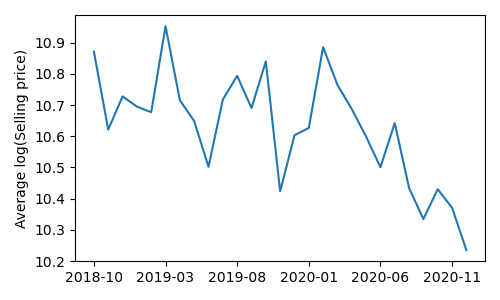
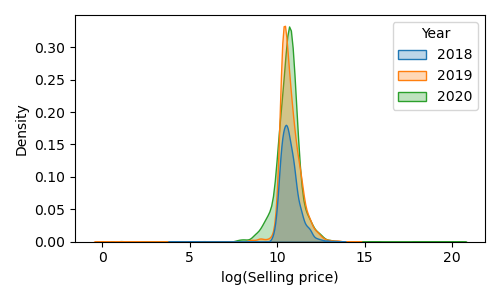
While the monthly trend was decreasing, the yearly average looks comparatively stable, shown as below.
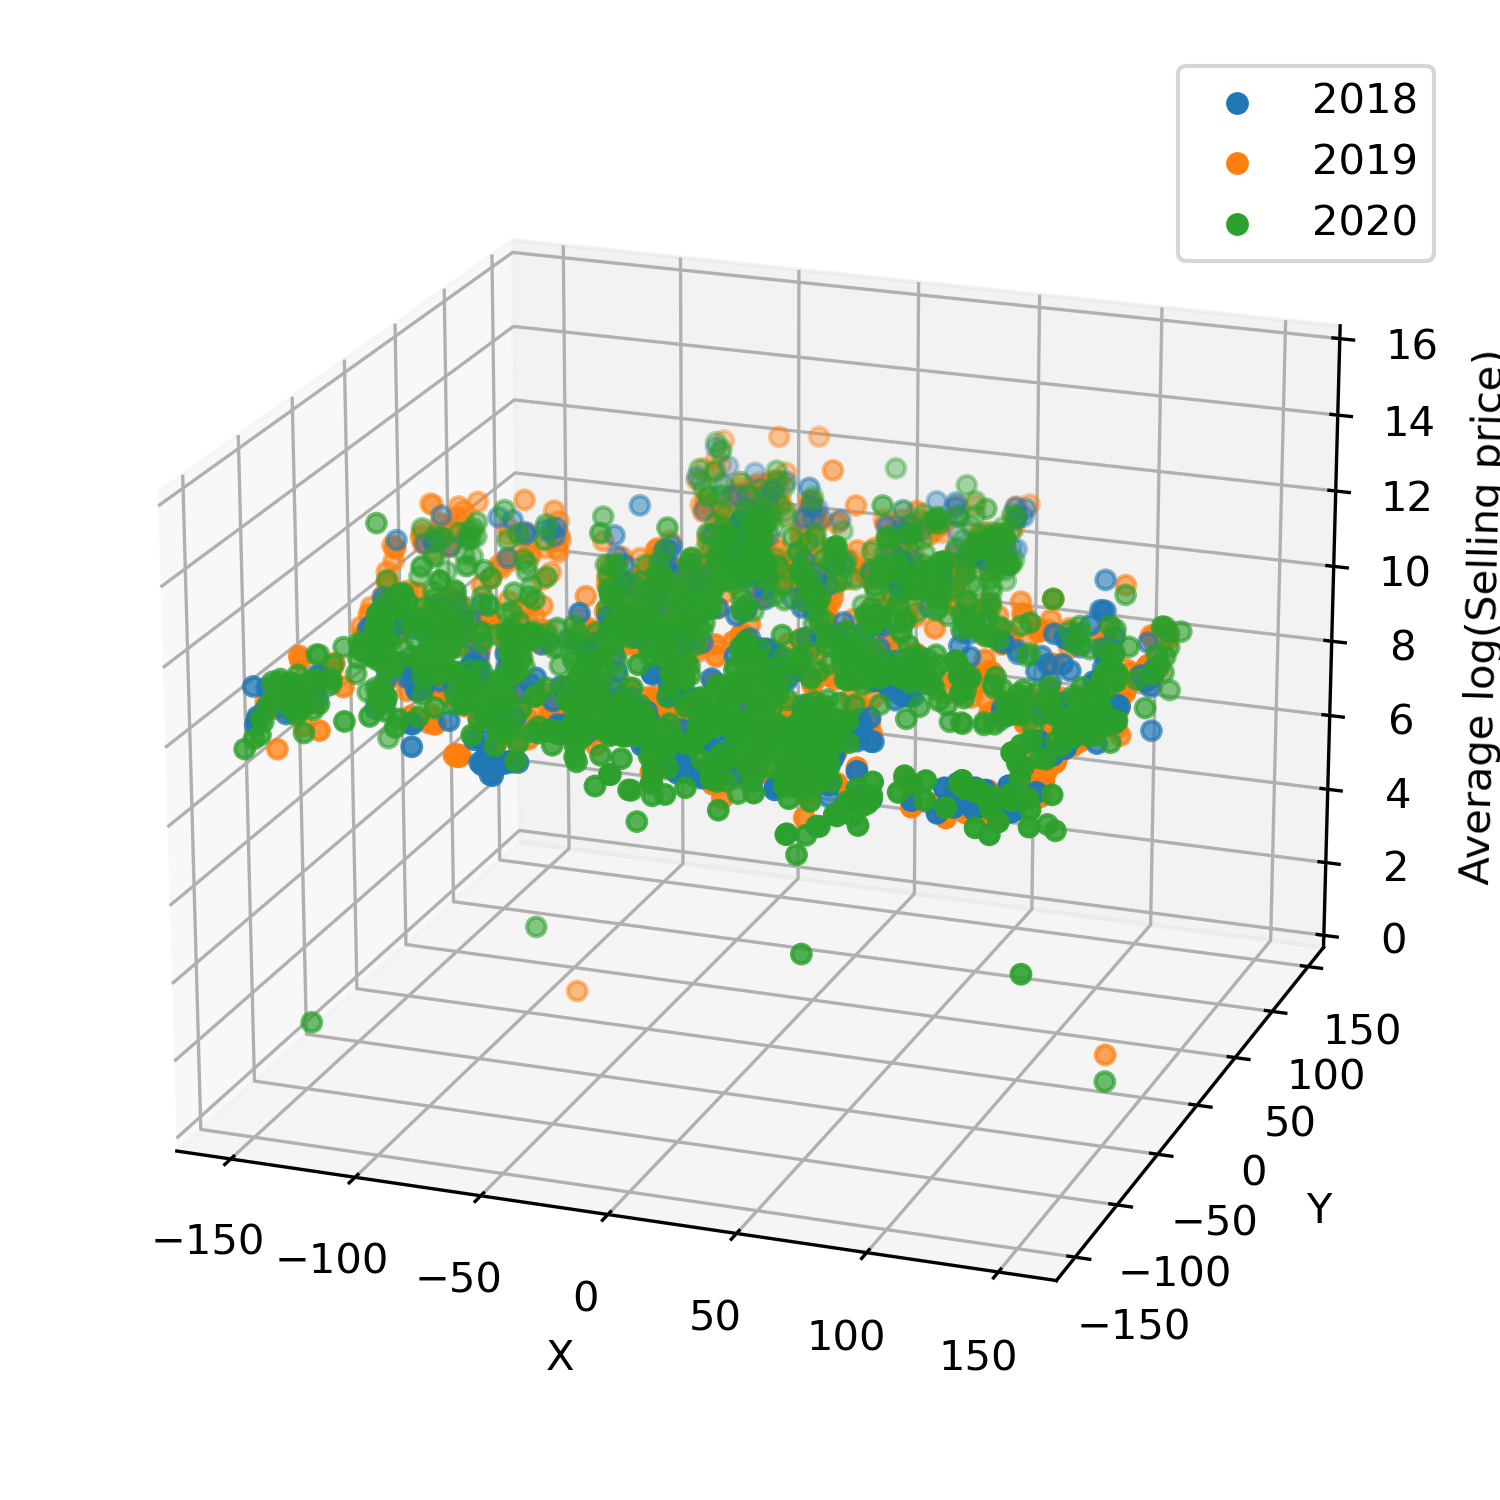
Of course, selling prices vary across different parcels, and the image below illustrates such a diversity.
The simple hedonic regression model is employed as the first statistical analysis. Parcel-specific characteristics considered include whether parcel $i$ is a part of road ($road$), the shortest Euclidean distances to origin ($distOrigin$), to road ($distRoad$), to plaza ($distPlaza$), and to district ($distDistrict$), and whether the sales was processed with MANA ($payMANA$) or Ether ($payETH$). The table below shows the estimation results of the hedonic regression model.
                          PanelOLS Estimation Summary
================================================================================
Dep. Variable:              LpriceUSD   R-squared:                        0.2706
Estimator:                   PanelOLS   R-squared (Between):              0.3614
No. Observations:                6107   R-squared (Within):               0.1667
Date:                Thu, Mar 24 2022   R-squared (Overall):              0.2706
Time:                        14:25:02   Log-likelihood                   -6312.0
Cov. Estimator:             Clustered
                                        F-statistic:                      60.841
Entities:                        3284   P-value                           0.0000
Avg Obs:                       1.8596   Distribution:                 F(37,6069)
Min Obs:                       1.0000
Max Obs:                       23.000   F-statistic (robust):             48.063
                                        P-value                           0.0000
Time periods:                      27   Distribution:                 F(37,6069)
Avg Obs:                       226.19
Min Obs:                       91.000
Max Obs:                       602.00

                               Parameter Estimates
==================================================================================
                Parameter  Std. Err.     T-stat    P-value    Lower CI    Upper CI
----------------------------------------------------------------------------------
const              6.9541     1.2318     5.6453     0.0000      4.5393      9.3689
road              -1.4484     0.0864    -16.756     0.0000     -1.6179     -1.2790
distOrigin        -4.7120     0.5047    -9.3361     0.0000     -5.7014     -3.7226
distRoad          -5.4304     0.4085    -13.293     0.0000     -6.2312     -4.6295
distPlaza          0.3961     0.2658     1.4903     0.1362     -0.1249      0.9171
distDistrict      -0.7604     0.1695    -4.4870     0.0000     -1.0926     -0.4282
distOriginSQ       4.9603     0.6684     7.4207     0.0000      3.6499      6.2707
distRoadSQ         10.209     1.0536     9.6894     0.0000      8.1437      12.275
distPlazaSQ       -1.7875     0.5089    -3.5124     0.0004     -2.7852     -0.7899
distDistrictSQ     0.8212     0.2178     3.7698     0.0002      0.3941      1.2482
payMANA            5.2532     1.2315     4.2657     0.0000      2.8391      7.6674
payETH             4.1757     1.2392     3.3696     0.0008      1.7463      6.6051
YM_2018-11        -0.2514     0.0378    -6.6553     0.0000     -0.3255     -0.1774
YM_2018-12        -0.1261     0.0392    -3.2149     0.0013     -0.2030     -0.0492
YM_2019-01        -0.1018     0.0409    -2.4861     0.0129     -0.1820     -0.0215
YM_2019-02        -0.1343     0.0926    -1.4502     0.1470     -0.3158      0.0472
YM_2019-03         0.1166     0.0369     3.1614     0.0016      0.0443      0.1889
YM_2019-04        -0.0939     0.0439    -2.1373     0.0326     -0.1801     -0.0078
YM_2019-05        -0.2070     0.0550    -3.7615     0.0002     -0.3149     -0.0991
YM_2019-06        -0.3419     0.0489    -6.9856     0.0000     -0.4379     -0.2460
YM_2019-07        -0.1064     0.0446    -2.3859     0.0171     -0.1938     -0.0190
YM_2019-08        -0.0218     0.0654    -0.3338     0.7385     -0.1501      0.1064
YM_2019-09        -0.1053     0.0468    -2.2507     0.0244     -0.1969     -0.0136
YM_2019-10         0.0411     0.0465     0.8841     0.3767     -0.0501      0.1324
YM_2019-11        -0.0696     0.0679    -1.0247     0.3056     -0.2027      0.0635
YM_2019-12        -0.0902     0.0521    -1.7319     0.0833     -0.1923      0.0119
YM_2020-01        -0.0220     0.0833    -0.2636     0.7921     -0.1853      0.1414
YM_2020-02         0.1263     0.0511     2.4691     0.0136      0.0260      0.2265
YM_2020-03         0.0402     0.0460     0.8742     0.3820     -0.0500      0.1304
YM_2020-04        -0.0756     0.0681    -1.1099     0.2671     -0.2090      0.0579
YM_2020-05        -0.1068     0.0486    -2.1972     0.0280     -0.2021     -0.0115
YM_2020-06        -0.0764     0.0679    -1.1261     0.2602     -0.2095      0.0566
YM_2020-07         0.0146     0.0509     0.2874     0.7738     -0.0852      0.1144
YM_2020-08        -0.3279     0.0992    -3.3055     0.0010     -0.5224     -0.1335
YM_2020-09        -0.4236     0.0476    -8.8963     0.0000     -0.5169     -0.3303
YM_2020-10        -0.3357     0.1087    -3.0892     0.0020     -0.5488     -0.1227
YM_2020-11        -0.2559     0.1256    -2.0369     0.0417     -0.5022     -0.0096
YM_2020-12        -0.5663     0.0413    -13.703     0.0000     -0.6473     -0.4852
==================================================================================
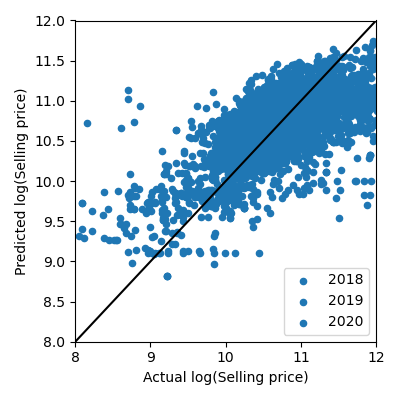
Based on the constructed hedonic regression model, the predicted $\log{(Selling \text{ } price)}$ values of the entire parcels are further generated. The figure below visualizes how the predicted values are distant from the actual values.